Occupancy Analytics Product Update April
Search News
New Occupancy Analytics Tools Are Here!
Dear customers and those considering installing Spaceti in your workplace
We’re constantly striving to improve our product for our customers.
And the result of those efforts are some great new occupancy analytics tools we’re proud to present today.
Enhanced Heatmap Table
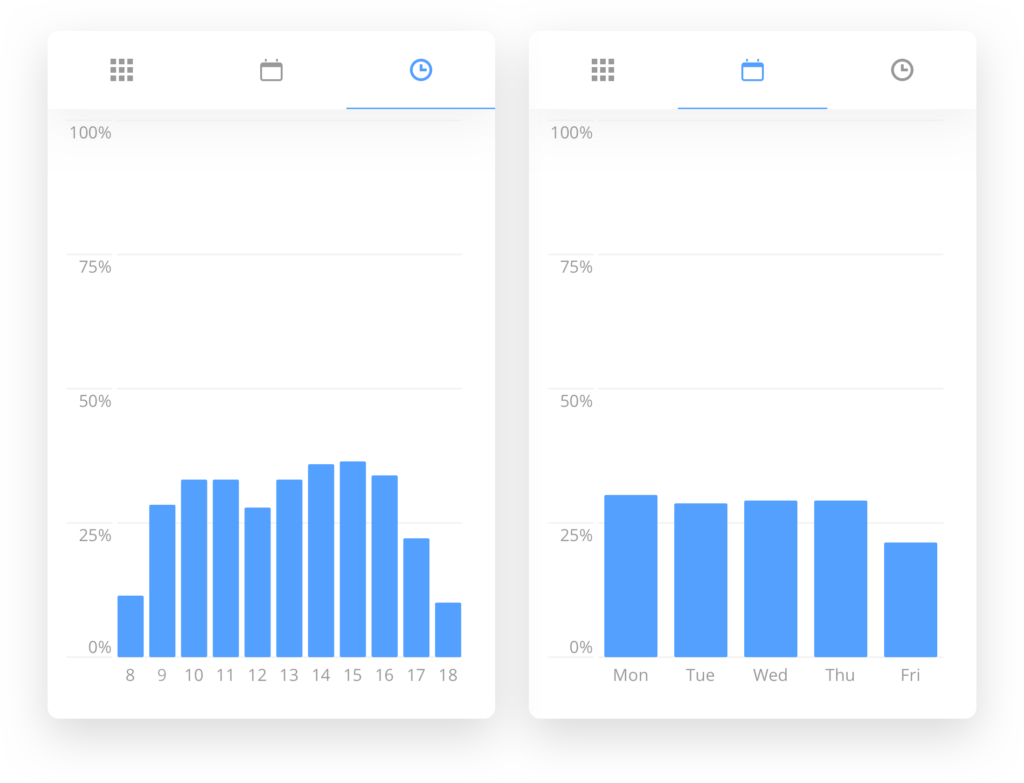
Our heat map table is cool. It allows you to look at your metrics by weekday and time. In the past, users were unable to view their data purely by weekday or work hours. This new update adds this feature and you can now switch between weekdays, work hours, and a combined view. Why is this important?
- As an organization, you not only want to be able to access your data by day, but also as an aggregated sum grouped by a workday, e.g. in January, what was your average occupancy on Tuesdays and Fridays? What was our average office occupancy at 9 am during Q1?
 Meeting Room Occupancy
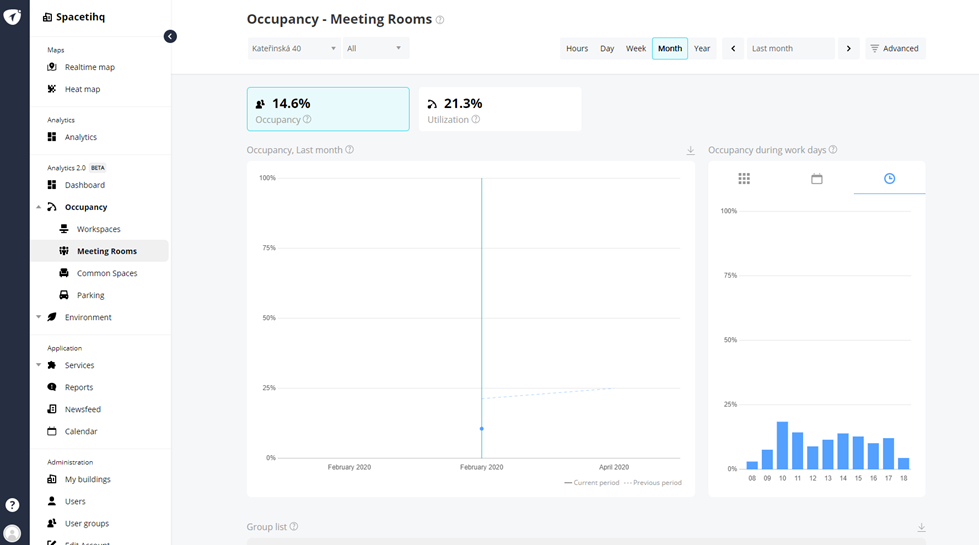
We’re adding a standard Occupancy Metric, which is the percentage of seats occupied out of the meeting room’s capacity. Please note this feature requires individual seat sensors. Why is it important?
- As an organization, you want to ensure you are using your resources effectively and that events and spaces are properly matched.

Occupancy Feature:
This shows occupancy within a selected time frame in relation to how many people used the space. For example, if a meeting room with a capacity of four people is used by 2 people, the occupancy is 50%. Note, there must be individual sensors for each seat to use this feature.
Utilization Feature:
This shows occupancy within a selected time frame in relation to how much of that time was used. For example, if the meeting room was used from 10:00 am to 10:45 am then the utilization between 10:00 am and 11:00 am is 75%, no matter how many there were in the room.
Get ready and start understanding your building better now! Interested in the Analytics? Please contact our team (see below).